
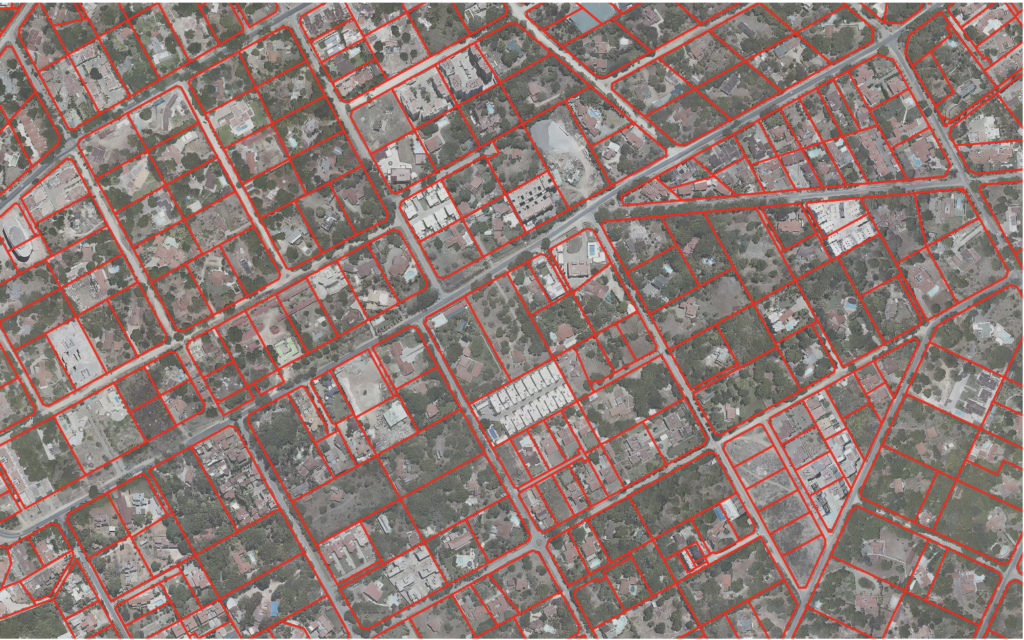
Cadastral layer refers to a specific type of spatial data layer that contains information related to land ownership, land parcels, property boundaries, and land records. Cadastral data is essential for land management, land administration, urban planning, real estate, and many other applications.
Cadastral layers include survey data with accurate coordinates and measurements, ensuring the precise representation of land parcel boundaries in a GIS.
The data can be used to determine the permitted and current land uses, zoning regulations, and land development policies, facilitating urban planning and development.
Cadastral layers can assist in environmental planning by identifying land with specific environmental designations or restrictions, helping to protect natural resources.
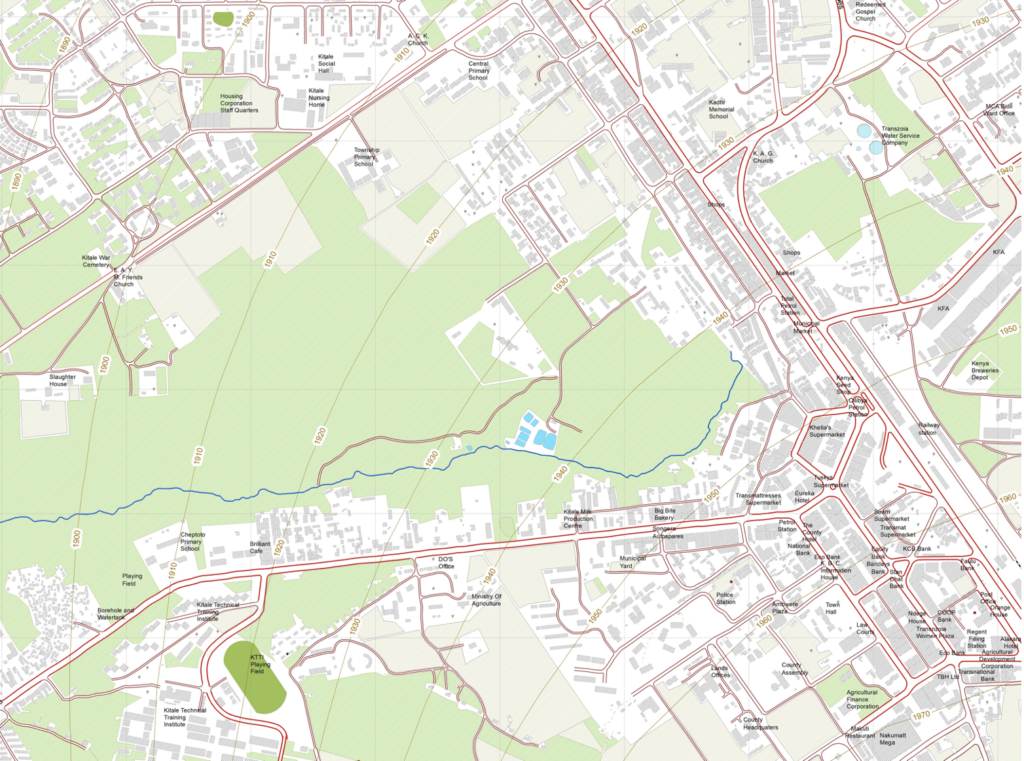
A topographic map is a specialized type of map that provides a detailed and accurate representation of the Earth’s surface features including its terrain, elevation and other physical characteristics.
Urban Planners and developers use these maps to understand the topography of an area and make informed decisions about land use, infrastructure development, and zoning regulations.
Surveyors use topographic maps to assess the lay of the land, measure distances and record elevation changes. These maps provide essential information for property boundaries, construction projects and infrastructure development.
Civil engineers use topographic maps to plan and design infrastructure projects like roads, bridges, dams and buildings. These maps provide vital information about the landscape’s features and elevation.
Topographic maps aid in the conservation of natural resources and the environment. They help identify areas with unique ecosystems habitats and geological features, assisting in the preservation of sensitive lands.
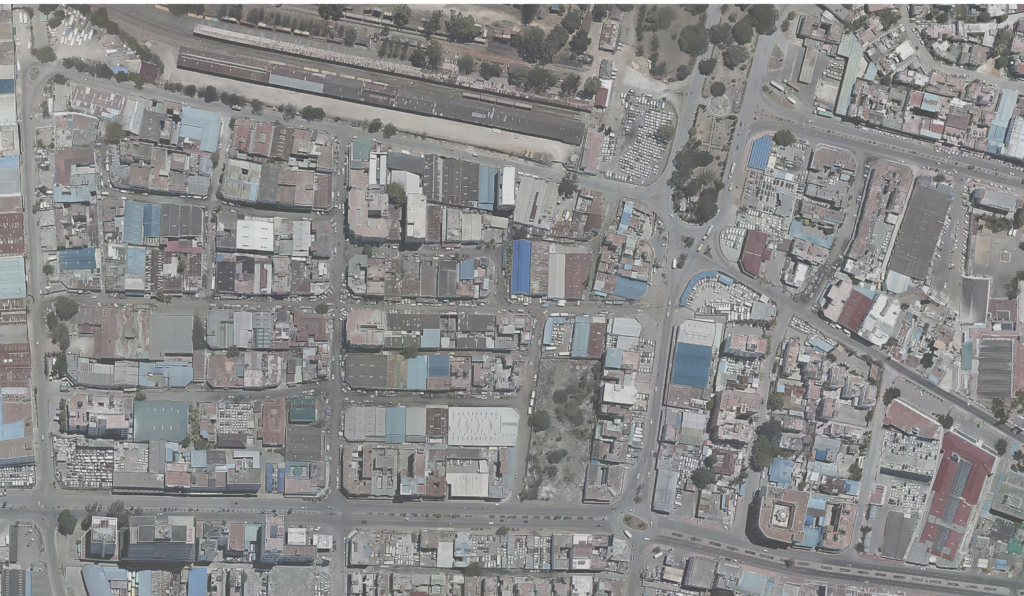
An image is a visual representation or depiction of an object, scene, concept or data in a two-dimensional format. Images play a crucial role in data visualization and analysis. Satellite images are obtained by remote sensing technology, where orbiting satellites equipped with cameras and sensors capture data from a distance while aerial images are captured from an elevated viewpoint, providing a top-down or oblique perspective of the Earth’s surface. Integrating the image with other data leads to effective analysis and visualization of an area.
City planners use images to assess land use, transportation networks and infrastructure planning. This helps in designing and managing urban areas efficiently.
Civil Engineers use these images for site assessment, construction progress monitoring, infrastructure maintenance and civil engineering projects.
Images contribute to monitoring of environmental changes such as wetland degradation, deforestation, coastal erosion and biodiversity loss
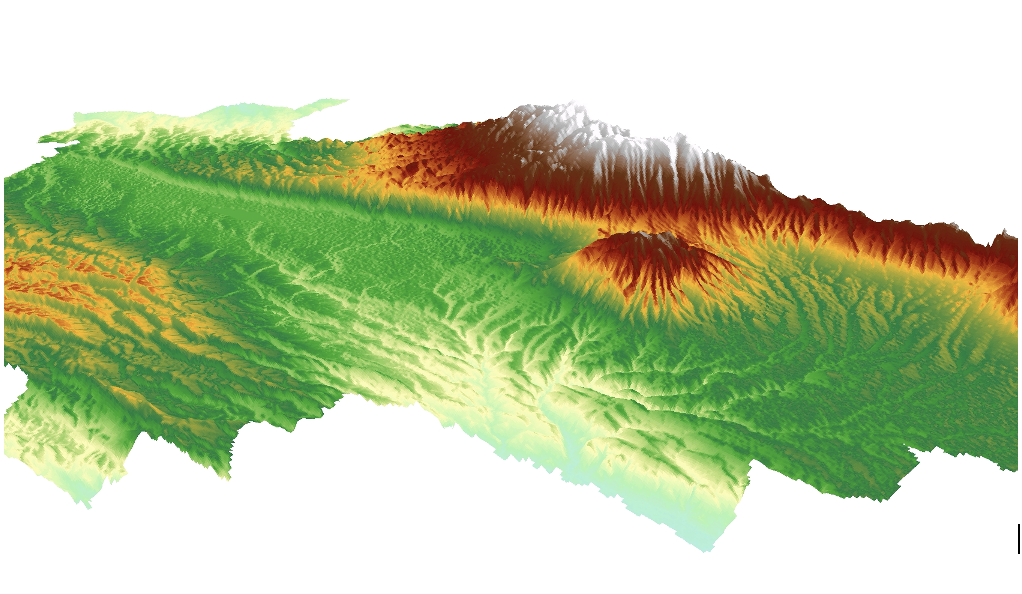
A terrain model, often referred to as a digital terrain model (DTM) or digital elevation model (DEM), is a digital representation of the Earth’s surface that captures its topography, elevation, and relief. Terrain models support 3D modelling and visualization.
These models are used for a variety of purposes, including spatial analysis, visualization, land management, and environmental assessment. they are often combined with other spatial data layers, such as land cover, land use, and property boundaries.
Terrain models contain elevation data, enabling the measurement and visualization of elevation changes across a landscape which is crucial for land surveying and environmental analysis.
Terrain models support urban planning by helping city planners and engineers assess land characteristics, slope analysis, and drainage patterns for infrastructure development, zoning regulations, and flood risk assessment.
Environmentalists use terrain models to study and monitor landforms, watersheds, erosion, and habitat suitability. These models aid in conservation efforts and the assessment of environmental impacts.
Civil engineers use terrain models to plan and design infrastructure projects such as roads, bridges, tunnels, and pipelines. These models provide crucial elevation data for accurate design.
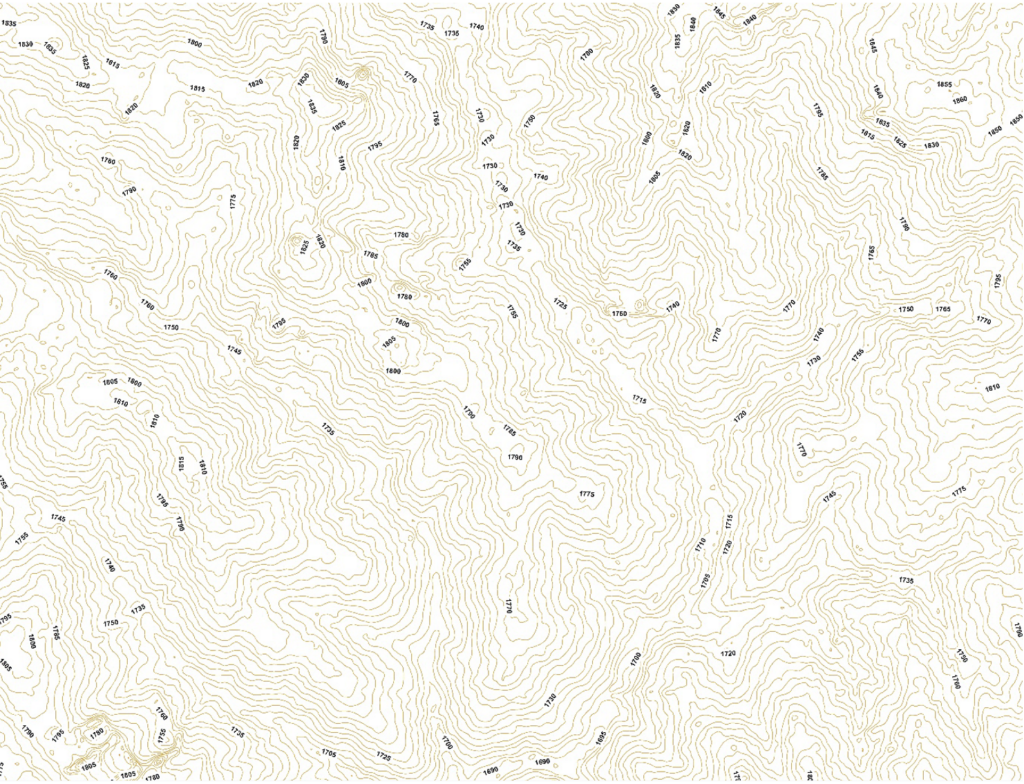
Contours are a representation of the shape and elevation of the Earth’s surface through lines on maps. Contour lines provide a clear and intuitive representation of the elevation of the Earth’s surface. They allow users to visualize the 3D shape of the terrain on a 2D map. Contours help in analyzing and understanding the landscape’s topography, including the location and extent of hills, valleys, mountains, ridges, and depressions.
Contours help identify and locate natural features such as valleys, ridges, hills, river courses, plateaus and depressions, aiding land planners in analysis.
Contour maps are essential in civil engineering projects, including road design, drainage planning, building construction, and land development. They provide critical information for site preparation.
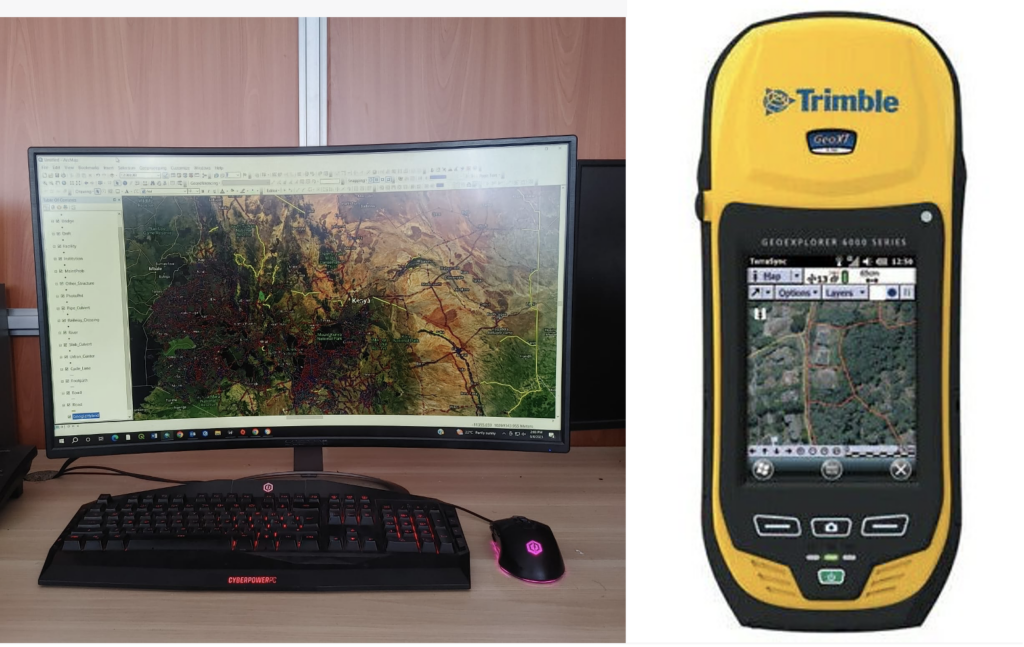
Hardware refers to the physical components and devices of a computer system or electronic device that can be seen and touched. These components play a fundamental role in the operation and functionality of the device. Hardware devices are used to support GIS operations, data processing, analysis, and visualization.
View the project
